|
In this section we introduce the ideas of sets and Venn diagrams. A set is a list of objects in no particular order; they
could be numbers, letters or even words. A Venn diagram is a way of representing sets visually.
To explain, we will start with an example where we use whole numbers from 1 to 10.
We will define two sets taken from this group of numbers:
Set A = the odd numbers in the group = { 1 , 3 , 5 , 7 , 9 }
Set B = the numbers which are 6 or more in the group = { 6 , 7 , 8 , 9 , 10 }
Some numbers from our original group appear in both of these sets. Some only appear in one of the sets.
Some of the original numbers don't appear in either of the two sets. We can represent these facts using a Venn diagram.

|
The two large circles represent the two sets.
The numbers which appear in both sets are 7 and 9.
These will go in the central section, because this is part of both circles.
The numbers 1, 3 and 5 still need to be put in Set A, but not in Set B, so these go in the left section of the diagram.
Similarly, the numbers 6, 8 and 10 are in Set B, but not in Set A, so will go in the right section of the diagram.
The numbers 2 and 4 are not in either set, so will go outside the two circles.
|
|
The final Venn diagram looks like this:
We can see that all ten original numbers appear in the diagram.
The numbers in the left circle are Set A
{ 1 , 3 , 5 , 7 , 9 }
The numbers in the right circle are Set B
{ 6 , 7 , 8 , 9 , 10 }
In the rest of this section you will practise filling in Venn diagrams and using them.
|

|
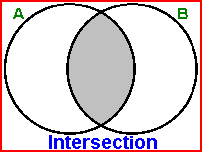 |
The intersection of sets A and B is those elements which are in set A and set B.
A diagram showing the intersection of A and B is on the left.
The union of sets A and B is those elements which are in set A or set B or both.
A diagram showing the union of A and B is on the right.
|  |
Example
Exercises
Work out the answers to the questions below and fill in the boxes. Click on the
 button to find out whether you have answered correctly. If you are right
then
button to find out whether you have answered correctly. If you are right
then  will appear and you should move on to the next
question. If will appear and you should move on to the next
question. If  appears then your answer is wrong. Click
on to clear your original answer and have another go.
If you can't work out the right answer then click on appears then your answer is wrong. Click
on to clear your original answer and have another go.
If you can't work out the right answer then click on
 to see
the answer. to see
the answer.
When filling in the venn diagrams, separate the numbers in each section with commas :

The (a), (b),
(c) and (d)
are only in the diagram to help you when you check the answers.
Produced by Al Reynolds for CIMT
|


 to see whether you are correct.
