|
Scatter graphs are a way of illustrating "paired" data - information about two related values.
For example : height and weight; price and sales; latitude and longtitude; rain and sunshine.
Example Question
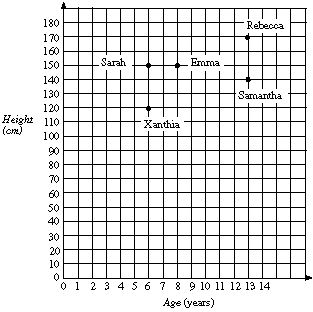
Look at the scatter graph below. The scatter graph shows height and age. Information for five
girls has been plotted on the graph. Look at the point marked Emma. We can see
from this point that Emma's height is 150 cm and her age is 8 years.
Exercises
Work out the answers to the questions below and fill in the boxes. Click on the
 button to find out whether you have answered correctly. If you are right
then
button to find out whether you have answered correctly. If you are right
then  will appear and you should move on to the next question. If will appear and you should move on to the next question. If
 appears then your answer is wrong. Click on to clear your original answer and have another go. If you can't work out the right answer then click on appears then your answer is wrong. Click on to clear your original answer and have another go. If you can't work out the right answer then click on
 to see the answer. to see the answer.
Question 1
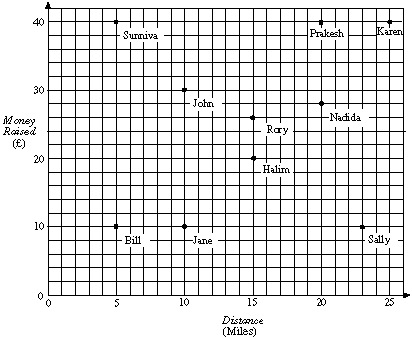
Ten children took part in a sponsored walk. The scatter plot shows how much money they raised and how far they walked.
Question 2
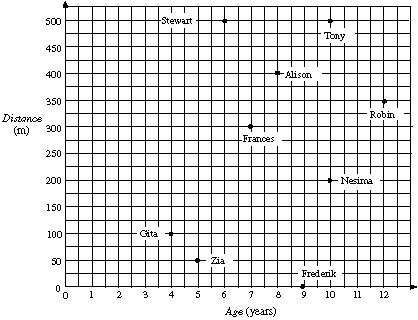
The scatter plot below shows the ages of some children and the greatest distance they can swim.
Question 3
In a sponsored swim, nine children each swam a certain distance and raised some money. In this question you will produce a scatter diagram for this information. You click on the graph to plot a point  using the information in the table on the left. Then you check to see if you have plotted the point correctly by clicking on the button. If you plotted the point correctly, it will be ticked using the information in the table on the left. Then you check to see if you have plotted the point correctly by clicking on the button. If you plotted the point correctly, it will be ticked  and will appear. If you see a cross and will appear. If you see a cross  on the point then you have made a mistake and must try again. You can remove points you have plotted incorrectly by clicking on them for a second time. on the point then you have made a mistake and must try again. You can remove points you have plotted incorrectly by clicking on them for a second time.
| 
 to see whether you are correct.