If you draw a line of best fit, it is possible to determine the equation of the line of best fit. You will remember that the equation of a straight line is given by
where m is the gradient and c is the intercept.

The points with coordinates (0, 6), (2, 7), (4, 8) and (6, 9) lie on a straight line.
Draw the line and determine its equation.

The points and the line are shown on the graph.
The intercept is 6.| The gradient = | = | , so the equation of the line is |
| y = | x + 6 |
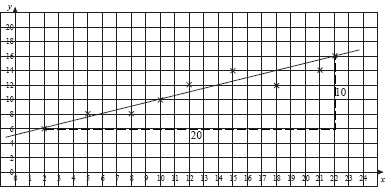
The following graph shows a scatter plot and a line of best fit:

Determine the equation of the line of best fit.

| c = 5, | m = | = |
| so the line of best fit has equation | y = | x + 5. |
Use the equation to estimate y when x = 4.
| y | = | × 4 + 5 | = | 2 + 5 | = | 7 |
Use the equation to estimate x when y = 18.
| 18 | = |
| |||
| 13 | = |
| (subtracting 5 from both sides) | ||
| x | = | 2 × 13 | (multiplying both sides by 2) | ||
| = | 26 |
In (b) above, the value of x used was within the range of values of x provided by the original data. We can be confident that the estimate we obtain is reasonable. This process is called interpolation.
In (c) above, the value of x we obtain is well outside the range of values of x provided by the original data. This process is called extrapolation and the results must be treated with caution as they may be very unreliable. In some cases, extrapolation can generate bogus predictions.