
When an inequality involves two variables, the inequality can be represented by a region on a graph. For example, the inequality

x + y ≥ 4
is illustrated on the graph on the right.
The coordinates of any point in the shaded area satisfy x + y ≥ 4.
Note
The coordinates of any point on the line satisfy

If the inequality had been x + y > 4, then a dashed line would have been used to show that points on the line do not satisfy the inequality, as in the second graph.
Worked Examples
Shade the region which satisfies the inequality
y ≥ 4x − 7
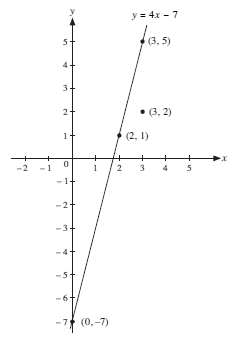
The region has the line y = 4x − 7 as a boundary, so first of all the line y = 4x − 7 is drawn.
The coordinates of 3 points on this line are
(0, − 7), (2, 1) and (3, 5)
These points are plotted and a solid line is drawn through them.
A solid line is drawn as the inequality contains a ' ≥ ' sign which means that points on the boundary are included.
Next, select a point such as (3, 2). (It does not matter on which side of the line the point lies.)
If the values, x = 3 and y = 2, are substituted into the inequality, we obtain
2 ≥ (4 × 3) − 7 or 2 ≥ 5
This statement is clearly false and will also be false for any point on that side of the line.

Therefore the other side of the line should be shaded, as shown.
Shade the region which satisfies the inequality
x + 2y < 10
The line x + 2y = 10 will form the boundary of the region, but will not itself be included in the region. To show this, the line should be drawn as a dashed line.
Before drawing the line, it helps to rearrange the equation as
y =
Now 3 points on the line can be calculated, for example (0, 5), (2, 4) and (4, 3).
This line is shown below.
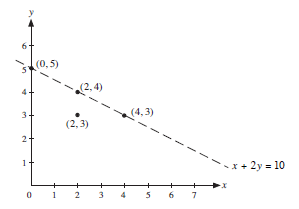
Next, a point on one side of the line is selected, for example (2, 3), where x = 2 and y = 3. Substituting these values for x and y into the inequality gives
2 + 2 × 3 < 10 or 8 < 10
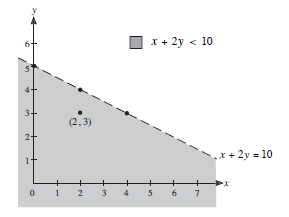
This is clearly true and so points on this side of the line will satisfy the inequality. This side of the line can now be shaded, as below.
Exercises
