
This is a method used to assign a meaning to the correlation between pairs of data points.
Such a coefficient, call it r, is designed so that
−1 ≤ r ≤ 1
and r = −1 corresponds to perfect negative correlation, r = 0 to no correlation and r = 1 to perfect positive correlation (as illustrated below).

Spearman's rank correlation coefficient is based on the squares of the differences between data points when they have been ranked – that is, put in numerical order and then given the values 1, 2, 3, ..., etc. The formula is
r=1-\frac{6\sum_{\ }^{\ }d^2}{n(n^2-1)}
Here n is the number of data points and d the difference between valuesYou will see a justification for this in the final worked example, but first we will see how to use the formula.
Worked Examples
At the Deepdale 'Best of British Pie' competition two judges award marks for nine different pies as follows:
| Pie | A | B | C | D | E | F | G | H | I |
| Judge 1 | 18 | 24 | 23 | 13 | 27 | 19 | 30 | 10 | 20 |
| Judge 2 | 7 | 18 | 9 | 4 | 17 | 8 | 29 | 5 | 10 |
What do the scores tell you about the two judges?
Show me The first judge appears to be using much higher scores than the second judge.Calculate Spearman's coefficient of rank correlation between the two judges.
Show meWe first find the 'ranks' and then the differences, and square them (note that squaring a negative number results in a positive value).
| Pie | A | B | C | D | E | F | G | H | I |
| Judge 1 | 18 | 24 | 23 | 13 | 27 | 19 | 30 | 10 | 20 |
| Judge 2 | 7 | 18 | 9 | 4 | 17 | 8 | 29 | 5 | 10 |
| Rank 1 | 3 | 7 | 6 | 2 | 8 | 4 | 9 | 1 | 5 |
| Rank 2 | 3 | 8 | 5 | 1 | 7 | 4 | 9 | 2 | 6 |
| d | 0 | –1 | 1 | 1 | 1 | 0 | 0 | –1 | –1 |
| d2 | 0 | 1 | 1 | 1 | 1 | 0 | 0 | 1 | 1 |
Summing the d^2 gives
\sum_{\ }^{\ }d^2 = 0 + 1 + 1 + 1 + 1 + 0 + 0 + 1 + 1 = 6
and, using the formula,
r=1-\frac{6\sum_{\ }^{\ }d^2}{n(n^2-1)} with \sum_{\ }^{\ }d^2 = 6 and n = 9 gives
r=1-\frac{6\times6}{9\times80}=1-0.05=0.95
What does your result tell you about the judges' decision?
Show meThe value of r is very close to 1, showing that there is highly positive correlation between the two judges' rankings (but not in their actual scores).
An investigation was conducted by a company on the value of various assessment methods for recruiting employees. The data are shown in this table.
| Employee | Educational Test Score | Assessment Score by Personnel Officer |
| A | 9 | 12 |
| B | 10 | 14 |
| C | 15 | 16 |
| D | 14 | 15 |
| E | 16 | 17 |
| F | 11 | 10 |
| G | 12 | 11 |
| H | 17 | 18 |
This is based on 8 employees, giving their educational test scores, together with an assessment score by the Personnel Officer of their ability one year after joining the company. Possible test scores in each case can range from a low of 1 to a high of 20.
Rank each employee in terms of Educational Test score and Assessment score by the Personnel Officer.
Show me| Employee | Educational Test Score | Assessment Score by Personnel Officer | RE | RA | d | d2 |
| A | 9 | 12 | 1 | 3 | –2 | 4 |
| B | 10 | 14 | 2 | 4 | –2 | 4 |
| C | 15 | 16 | 6 | 6 | 0 | 0 |
| D | 14 | 15 | 5 | 5 | 0 | 0 |
| E | 16 | 17 | 7 | 7 | 0 | 0 |
| F | 11 | 10 | 3 | 1 | 2 | 4 |
| G | 12 | 11 | 4 | 2 | 2 | 4 |
| H | 17 | 18 | 8 | 8 | 0 | 0 |
Hence for these scores calculate, to 2 decimal places, the Spearman rank correlation coefficient.
Show men = 8 and \sum_{\ }^{\ } d^2 = 16, so
r = 1 - \frac{6 × 16}{8 × 63} = 1 - 0.19 = 0.81
The recruits also took an aptitude test and the comparable value for the rank coefficient based on aptitude test score and assessment score by the Personnel Officer was –0.21.
With reference to this result and your answer in (b) comment on the effectiveness of the tests in providing the Personnel Officer with an indication of the suitability of applicants for employment.
Show meThe educational test seems to work well (fairly positive correlation) but the aptitude test does not work well (slightly negative correlation).
In a music festival, each competitor is judged on his performance on two different musical instruments. The judge awards marks out of 100 for each instrument, as follows.
| Competitor | A | B | C | D | E | F |
| 1st Instrument | 90 | 75 | 62 | 70 | 75 | 56 |
| 2nd Instrument | 95 | 76 | 64 | 76 | 86 | 60 |
Complete a table of ranks.
Show me| Competitor | A | B | C | D | E | F |
| 1st Instrument | 90 | 75 | 62 | 70 | 75 | 56 |
| 2nd Instrument | 95 | 76 | 64 | 76 | 86 | 60 |
| Rank 1 | 1 | 2.5 | 5 | 4 | 2.5 | 6 |
| Rank 2 | 1 | 3.5 | 5 | 3.5 | 2 | 6 |
(Note that we have marked the highest rather than the lowest as 1; this is not a problem provided that both sets of rankings are done in the same way.
Also, if there are two tied ranks, we use the average of the two values, here 2 and 3, so we use 2.5 for each.)
The rank correlation coefficient for these data was found to be 0.96.
It was later discovered that the marks from one of the judges, for one competitor, had been misread. This competitor should have had 10 more marks on his second instrument.
The mark was changed and on recalculation it was found that the correlation coefficient remained the same at 0.96.
Which competitor's mark was originally incorrect?
Show meCompetitor C
Give a reason for your answer.
Show meOnly the '64' entry (i.e. competitor C, 2nd instrument) will not have their rank affected by an increase of 10 marks. Hence competitor C must have the incorrect mark.
For sets of paired data, find the value of \sum_{\ }^{\ }d^2 for
(i) perfect positive correlation,
(ii) perfect negative correlation when n = 2, 3, 4, . . . , 8 .
Hence deduce Spearman's rank correlation coefficient formula, assuming it is of the form
r = 1 - k \sum_{\ }^{\ }d^2
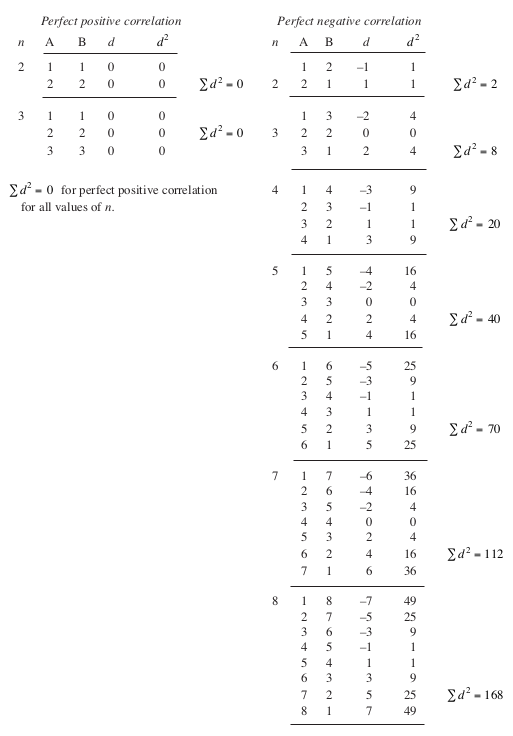
Assume that Spearman's correlation coefficient takes the form
r=1-k\sum_{\ }^{\ }d^2
(since this gives r = 1 when \sum_{\ }^{\ }d^2 = 0, i.e. perfect positive correlation).
Now the constant k will depend on n (the number of data points) and must be chosen so that when there is perfect negative correlation, then r = -1 ; i.e.
-1=1-k\sum_{\ }^{\ }d^2\ ⇒\ k=\frac{2}{\sum_{\ }^{\ }d^2}
Tabulating the values obtained gives
| n | \sum_{\ }^{\ }d^2 |
| 2 | 2 |
| 3 | 8 |
| 4 | 20 |
| 5 | 40 |
| 6 | 70 |
| 7 | 112 |
| 8 | 168 |
from which you can see that
Hence, using the formula for \sum_{\ }^{\ }d^2,
k=\frac{6}{n(n^2-1)}
andr=1-\frac{6\sum_{\ }^{\ }d^2}{n(n^2-1)}
(which is Spearman's formula).Exercises
