
You will have met the idea of trend lines – these are essentially 'lines of best fit'. Note that there is little value in attempting to draw lines of best fit unless there is either strong positive or strong negative correlation between the points plotted, as shown in the following diagrams.
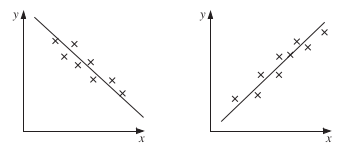
Also note that the lines of best fit should always pass through the point representing the mean values, \overline{x} and \overline{y}, of the data points.
Worked Examples
A sample of 8 U.S. Companies showed the following Sales and Profit levels for the year ending April 1994.
| Sales Turnover ($m) (x) | 22 | 36 | 26 | 14 | 25 | 34 | 6 | 18 |
| Profit ($m) (y) | 1.8 | 4.9 | 0.8 | 0.9 | 3.2 | 3.7 | 0.5 | 2.1 |
Draw a scatter diagram of this information.
Show me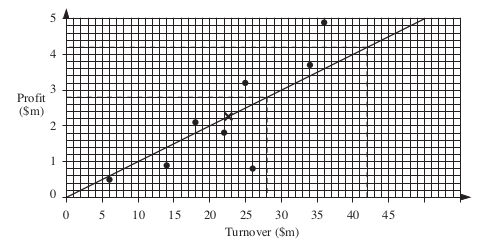
After making suitable calculations draw in a line of best fit and use this to estimate Profit levels for two companies with annual turnovers respectively of $28m and $42m.
Show meThe mean values are calculated as \overline{x} = 22.6, \overline{y} = 2.24 , and shown on the scatter diagram. (The line of best fit will pass through this point.)
For x = $28m the estimate of the profit is $2.8m, and for x = $42m , the estimate is $4.2m.
State briefly which of the estimates in (b) is likely to be more accurate. Justify your choice.
Show meThe estimate for a turnover of $28m is likely to be more accurate than for $42m, as the latter is outside the range of data on which the line of best fit is based.
Brunel plc is keen to set up a forecasting system which will enable them to estimate maintenance for delivery vehicles of various ages.
The following table summarises the age in months (x) and maintenance cost (y) for a sample of ten such vehicles.
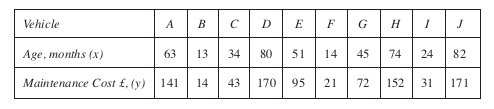
Draw a scatter diagram of the data on graph paper.
Show meSee the diagram in (c).
Find the mean value of the ages (x) and maintenance cost (y).
Show me \overline{x} = 48, \overline{y} = 91Use your results from (b) and the fact that the line of best fit for the data passes through the point (20, 24.5) to draw this line on the graph.
Show me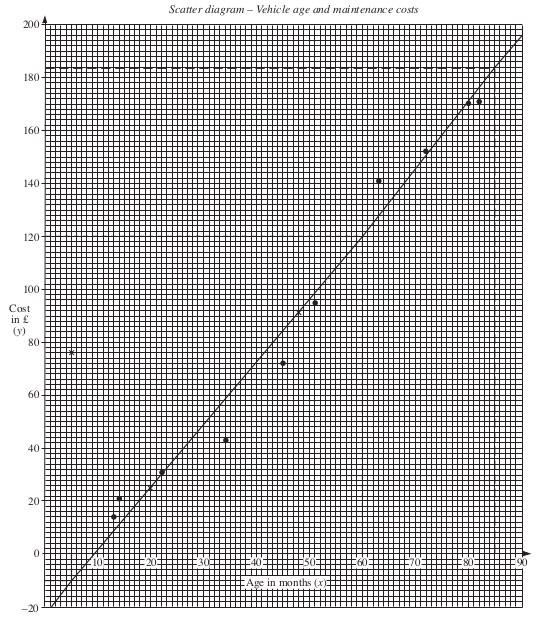
Estimate from your line the maintenance cost for a vehicle aged
85 months Show me £184
5 months Show me - £10
60 months. Show me £120
Order these forecasts in terms of their reliability, listing the most reliable first.
Justify your choice.
£120 (in middle of data range), £185 (just outside data range), - £10 (makes no sense!)
An electric heater was switched on in a cold room and the temperature of the room was taken at 5 minute intervals. The results were recorded and plotted on the following graph.
Given that \overline{x} = 15 and \overline{y} = 7.4 , draw a line of best fit for these data.
Show me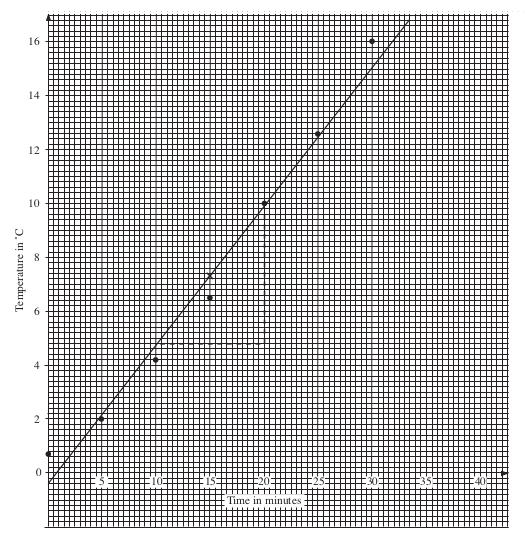
Obtain the equation of this line of best fit in the form y = mx + c , stating clearly your values of m and c .
Show meIntercept c = −0.4 and slope, m = \frac{10 - 4.8}{10}, (see triangle drawn on graph)
i.e. m = 0.52 ,
so
An alternative approach would be to note the intercept c = −0.4 from the diagram, so that
y = mx - 0.4
To pass through the point \overline{x} = 15, \overline{y} = 7.4 means that
7.4 = 15 m - 0.4
15 m = 7.4 + 0.4
m = \frac{7.8}{15} ≈ 0.52
giving the equation
y = 0.52x - 0.4
Use your equation to predict the temperature of the room 40 minutes after switching on the fire,
Show me| Predicted temperature | = 0.52 × 40 - 0.4 |
| = 20.4 °C |
Give two reasons why this result may not be reliable.
Show meThe value of 40 minutes is outside the range of values on which the line of regression is based; the heater may not continue to increase if it has a thermostat on it.
Mr Bean often travels by taxi and has to keep details of the journeys in order to complete his claim form at the end of the week. Details for journeys made during a week are:

On graph paper, plot the above points.
Show me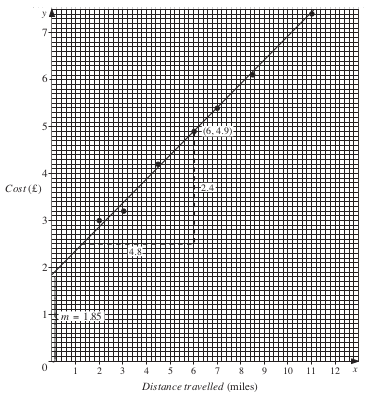
Calculate the mean point of these data and use this line to draw the line of best fit on your graph.
Show medistance, \overline{x} = 6; cost, \overline{y} = 4.9
Obtain the equation of your line of best fit in the form y = mx + c .
Show meFrom the intercept, c = 1.85 , and from the construction, the gradient = \frac{2.4}{4.8} = 0.5
Thus
y = 0.50x + 1.85
Give an interpretation for the value of c in your calculation.
Show meThe intercept is the value of y when x = 0 , i.e. the cost involved when the taxi is not being used.
Exercises
