
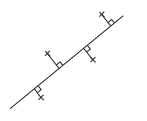
In the previous section, we used lines of regression by drawing these as accurately, by eye, as possible.
Here we will extend this and show how to use a formula to find the accurate line of regression.
If you have a set of paired data points (x_i, x_i) for which there is strong correlation (positive or negative), the problem is to find the line which best fits the data.
It may seem natural to try to find the line so that the points' distances from it have as small a total as possible, However, since the line will need to produce values of y for given values of x (or vice versa) it is more sensible to seek to produce a line so that any distances in the y direction, and therefore any errors in preparing y given x, should be a minimum.
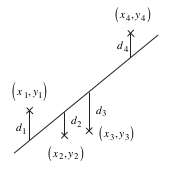
If the line is to be used to predict values of y based on known values of x it is called the 'y on x' line and its equation is determined by making d_1^2 + d_2^2 + ... = \sum_{\ }^{\ } d^2 as small as possible. The equation of this line can be shown to be
and for this line it can also be shown that ∑_{\ }^{\ } d^2 = ns_y^2(1 - r^2). You will notice that when r = ± 1 , (i.e. the points lie exactly on a straight line), then ∑_{\ }^{\ } d^2 = 0 as would be expected. The procedure used to obtain the equation is called the method of least squares and the 'd's are often referred to as residuals. The gradient is called the regression coefficient.
Worked Examples
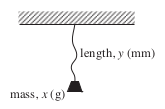
Data obtained from an experiment in which different weights were attached to an elastic band and the length of the band measured, are given in the following table.


In the diagram opposite, the points lie very close to a straight line and the value of r is 0.999.
\overline{x} = \frac{1800}{8} = 225,\ \ \overline{y} = \frac{597}{8} = 74.625
s_{xy} = \frac{156150}{8} - 225 * 74.625 = 2728.125
s_x^2 = \frac{510000}{8} - 225^2 = 13125
⇒ y - 74.625 = \frac{2728.125}{13125}(x - 225)
⇒ y = 0.208x + 27.857
The values of 0.208 and 27.857 represent the gradient of the line and its intercept on the y-axis and are available directly from a calculator with LR mode. The gradient has units mm/g and tells us how much extension would be caused by the addition of 1 extra gram to the suspended mass. This line can now be used to find values of y given values of x.
Using the equation found in Worked Example 1, what length would you expect the elastic band to be if a weight of
375 g
Show meWhen
| x | = 375 g, |
| y | = 0.208 × 375 + 27.857 |
| ≈ 106 mm |
1 kg
Show meWhen
| x | = 1 kg = 1000 g, |
| y | = 0.208 × 1000 + 27.857 |
| ≈ 236 mm |
Exercises
