
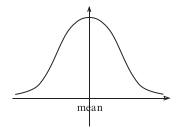
The normal distribution is a very useful way of summarising and working with data sets. Many data sets, such as IQ (intelligence quotient), shoe size, length of travel time between two locations, etc. can be approximated by a distribution of the form shown opposite, that is, bell- shaped and symmetric about the mean.
The following data gives the length from top to tail (in millimetres) of a large group of frogs. This has been run through a computer package so you can see some useful facts about the data.
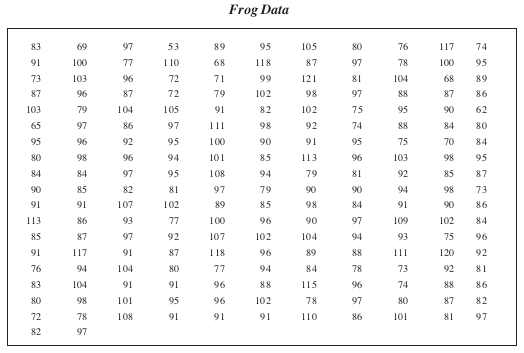
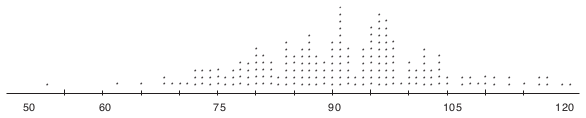

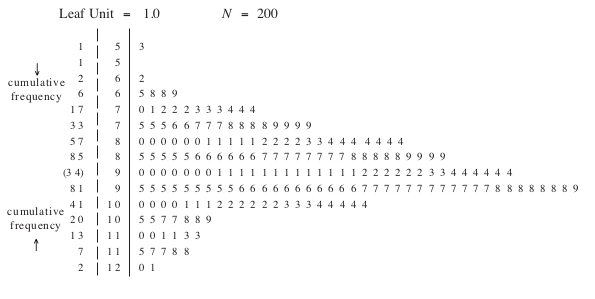
In the computer analysis you will see that most of the frogs are close to the mean value, with fewer at the extremes. This 'bell-shaped' pattern of distribution is typical of data which follows a normal distribution. To obtain a perfectly shaped and symmetrical distribution you would need to measure thousands of frogs.
You may notice that median ≈ mean ≈ mode, as might be expected for a symmetrical distribution. From the analysis of data you also see that the mean is 90.9 mm and the standard deviation is 11.7 mm. Now look at how much of the data is close to the mean, i.e. within one standard deviation (SD or s.d.) of it. From the stem and leaf table you can see that 74 frogs have a length within one standard deviation above the mean and 59 within a SD below the mean.
Altogether, 133 frogs are + or − one SD from the mean, which is 66.5% of the population sample.
IQ test scores, and the results of many other standard tests, are designed to be normally distributed with mean 100 and standard deviation 15.
In fact, the normal distribution is designed so that 68% of the population lie within 1 standard deviation of the mean, 95% within 2 standard deviations, and can be summarised as:

Therefore statements such as the following can be made:
'68% of all people should achieve an IQ score between 85 and 115.'
'Only 2% of people should have an IQ score less than 70.'
'Only 1 in a 1000 people have an IQ greater than 145.'
Worked Examples
Exercises
