
The method needed to transform any normal variable to the standardised variable is illustrated in the example below.
Worked Examples
Eggs laid by a particular hen are known to have lengths normally distributed, with mean 6 cm and standard deviation 1.4 cm. What is the probability of:
finding an egg bigger than 8 cm in length;
Show me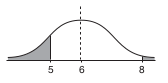
The number of SDs that 8 is above the mean is given by
z = = = 1.429
but Φ(1.43) = 0.92364 (from tables)
so P(X > 8) = 1 − 0.92364 = 0.07646.
finding an egg smaller than 5 cm in length?
Show mez = = −0.7143
but Φ(0.7143) = 0.7625 (from tables using interpolation),
so P(X < 5) = 1 − 0.7625 = 0.2375.
Note that in order to find the probability you need to establish whether you need the area greater than a half or less than a half. Drawing a diagram will help.
When a variable X follows a normal distribution, with mean m and variance σ2, this is denoted by
So in the last example, X ~ N(6, 1.42).
To use normal tables, the transformation
is used. This ensures that Z has mean 0 and standard deviation 1, and the tables are then valid.
The tallest person in recorded history for whom there is irrefutable evidence of height is Robert Wadlow (1918 - 1940), an American who was born and raised in Illinois. He reached the height of 2.72 m (8 ft 11.1 in)
Using the UK data on heights in the Exercise in section 6.1, the z value for Robert Wadlow's height is
z = ≈ 11.5
So his height is 11.5 SDs above the mean. The most accurate tables show that 6 SDs is only exceeded with a probability of 10−10, so it is extremely unlikely that a taller person will ever appear in our lifetime!
If X ~ N(4, 9), find
P(X > 6)
Show meHence
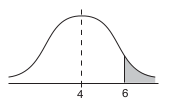
| P(X > 6) | = 1 − P(X < 6) |
| = 1 − Φ() | |
| = 1 − Φ(0.67) | |
| = 1 − 0.74857 | |
| = 0.25143 |
P(X > 1)
Show me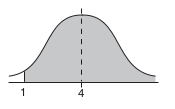
| P(X > 1) | = P(X < 7) (by symmetry) |
| = Φ() | |
| = Φ(1) | |
| = 0.84134 |
Exercises
