
When conducting a survey it is often impossible to ask every individual who might be concerned or involved. For example, for a political opinion poll it is only possible to ask a sample of the population how they would vote.
The term population can be any group about which information is required. For example, the following could be populations:
- Manchester United supporters,
- DVDs produced in a factory,
- adult voters in England,
- all students in your school.
Conclusions are often reached by looking at a sample taken from a population. There are three main methods for selecting a sample from a population:
Random Sample
The sample is formed by selecting members of the population at random. It is important to make sure that each member of the population is equally likely to be selected. Tables of random numbers can be used to help this process but more mundane methods, such as using numbers from a telephone directory or even choosing a number from a hat of numbers, can be used. Scientific calculators also provide you with random numbers.
Systematic Sample
This type of sample is formed by taking members of the population at regular intervals. For example, by selecting every 5th or every 10th or every 12th member of the population.
Stratified Sample
The population is split into a number of groups. Random samples are then taken from each group so that the ratio of the sizes of the sample is the same as the ratio of the number of members of the groups in the population. For example, if a population contains 1000 women and 500 men, a stratified sample of total size 75 would contain 50 women and 25 men.
Worked Examples
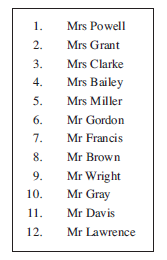
There are 12 teachers in a small school. A sample of size 4 is to be selected from this population.
Create a systematic sample for the population.
Show meAs there are 12 teachers, a systematic sample could be made by selecting every third teacher from the list. This would create a sample containing:
Mrs Clarke, Mr Gordon, Mr Wright and Mr Lawrence.
Create a random sample for the population.
Show me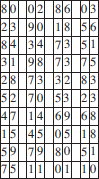
The list of random numbers shown here has been generated using a spreadsheet. The numbers have been arranged to give two-digit numbers. Numbers greater than 12 are not needed in this case so these numbers can be deleted.
Beginning in the top left-hand corner and working down the columns gives the result shown below.
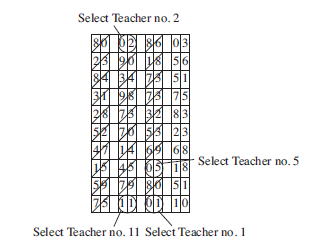
The teachers selected by this are:
| No. 2 | Mrs Grant |
| No. 11 | Mr Davis |
| No. 5 | Mrs Miller |
| No. 1 | Mrs Powell |
| Year | Number of students |
| 10 | 320 |
| 11 | 300 |
| 12 | 180 |
| 13 | 150 |
A head teacher wishes to select a stratified sample of 50 students from Years 10, 11, 12 and 13. The table shows how many students are in each year.
First find the total number of students in the population.
| Total | = 320 + 300 + 180 + 150 |
| = 950 |
The fraction of the population in Year 10 is .
So the number of students selected from Year 10 is given by:
× 50 = 16.84, so select 17 students.
The number of students selected from Year 11 is given by:
× 50 = 15.79, so select 16 students.
The number of students selected from Year 12 is given by:
× 50 = 9.47, so select 9 students.
The number of students selected from Year 13 is given by:
× 50 = 7.89, so select 8 students.
Exercises
