
Data Presentation
Pie Charts

Pie charts, which represent quantities as sectors of a circle, can be used to illustrate data. They are particularly effective if there is only a small number of items to illustrate. In total a complete circle, i.e. 360°, must always be used.

Worked Examples

1

Tracey uses her pocket money of £18 per month in the following way.

Books£4
Sweets£3
Sport£6
Transport£4
Savings£1

Draw a pie chart to show how Tracey uses her pocket money.

Show me

Tracey has a total of £18.

= 20°

So 20° should be used for each £1. The angles needed are given in this list.

Books4 × 20° = 80°
Sweets3 × 20° = 60°
Sport6 × 20° = 120°
Transport4 × 20° = 80°
Savings1 × 20° = 20°

Alternatively, you could calculate each angle by taking the appropriate fraction of 360°.

For example, for Books, we have

× 360° = 80°

and for Sweets,

× 360° = 60°, etc.

The pie chart can now be drawn.

The diagram below, on the left, shows the first section for 'Books'.
The completed pie chart is on the right.

2

The pie chart was constructed after asking 72 students how they travel to school.

(a)

How many of these students travel to school by:

There are 72 students so

= 5° per student

(i)

car,

Show me

The angle for travelling by car is 40°.

= 8

So 8 students travel by car.

(ii)

bus,

Show me

The angle for travelling by bus is 20°.

= 4

So 4 students travel by bus.

(iii)

taxi?

Show me

The angle for travelling by taxi is 110°.

= 22

So 22 students travel by taxi.

(b)

What percentage walk to school?

Show me

The number who walk to school is given by

= 38

so the percentage who walk is

× 100 ≈ 52.8%

Note

Alternatively, you could just use the angles in the pie chart to give

× 100 ≈ 52.8%

3

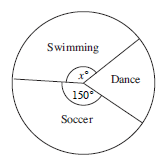
The pie chart below, not drawn to scale, shows the Saturday morning activities of a group of 120 children.
(a)

The sector for soccer is represented by an angle of 150°. Determine the number of children who play soccer on Saturday mornings.

Show me
Number playing soccer = × 120
= 50 children
(b)

Given that 46 children swim on Saturday mornings, calculate the value of x.

Show me
Angle for swimming = × 360°
= 138°
(c)

Determine the probability that a child chosen at random, dances on Saturday mornings.

Show me
Number dancing = 120 − (50 + 46)
= 120 − 96
= 24
So probability of dancing = =

(Probability is covered in detail in another units.)

Exercises

In an opinion poll 360 people were asked who they would vote for in the next election. Their responses were:

Conservative160
Labour170
Liberal Democrat20
UKIP10

Give the angles of each party on a pie chart.

Conservative: °

Labour: °

Liberal Democrat: °

UKIP: °

Bethany recorded how she spent the last 24 hours. Her results are shown below.

Sleeping9 hours
School7 hours
Homework2 hours
Watching TV3 hours
Eating1 hour
Travelling2 hours

Work out the angles of this information in a piechart.

Sleeping: °

School: °

Homework: °

Watching TV: °

Eating: °

Travelling: °

A student estimated that he had 30 hours available each week for home study and for sports. The table below shows the percentage of time he spent on each activity.

Activities%
Languages30
Mathematics20
Computer Studies15
Sciences15
Sportsx
(a)

Calculate the number of hours he spent on sports.

hours
(b)

Calculate the angles in a pie chart that would be used to represent the hours spent on

(i)

Mathematics

°
(ii)

Languages.

°
(c)

One hour in the 30 hours is chosen at random. Calculate the probability that the student is

(i)

playing sports

(ii)

studying Mathematics or Languages.

The pie chart shows how the time Robert spends watching television is split between different channels, for one day.

Ron spends 1 hour watching BBC One.

(a)

How long does he spend watching ITV2?

hours
(b)

How long does he spend watching Sky Sports?

hours

The pie chart shows the football teams supported by a class of students. There are 3 students who support Harbour View.

(a)

What is the angle representing Tivoli Gardens?

°
(b)

How many students support Boys Town?

students
(c)

How many students are there in the class?

students
(d)

How many students support Portmore United?

students

A Post Office in a village dealt with 720 letters in one week. They were sorted into First Class, Second Class and Air Mail.

The pie chart shows the different number of each type.

How many letters of each type were handled?

Air Mail =

1st Class =

2nd Class =

This question is about the way water is used in two Mozambique villages.

(a)

In village A, 324 litres of water are used each day. The pie chart shows how the water is used.

(i)

How much water is used each day for cooking?

litres
(ii)

What fraction of the water used is given to animals?

(b)

In village B, the water is used as follows:

Cooking20%°
Washing themselves50%°
Washing clothes20%°
Washing pots10%°

Write in the missing angles of the sectors in a piechart.