
There are many ways of representing data. For example, you should already be familiar with
histograms and pie charts
but there is another very simple way which quickly gives an overall view of the general characteristics of the data. This is called a
stem and leaf plot
and the following example illustrates how it works.
Suppose the marks gained out of 50 by 15 pupils in a Biology test are as given below.
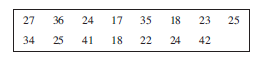
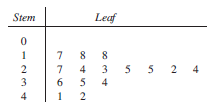
We form a stem and leaf plot by recording the marks with the 'tens' as the stem and the 'units' as the leaf, as shown opposite.
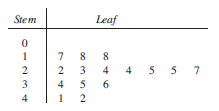
The leaf part is then reordered to give a final plot as shown.
This gives at a glance both an impression of the spread of the numbers and an indication of the average.
Worked Examples
Form a stem and leaf plot for the following data.

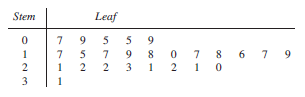
Without reordering we have,

and reordering,
Blood samples were taken from forty blood donors and the lead concentration (in mg per 100 ml) in each sample was determined. The results are given below.
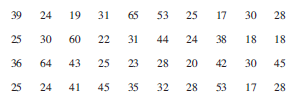
Construct a stem and leaf diagram to represent these data.
Show meReading from the table,
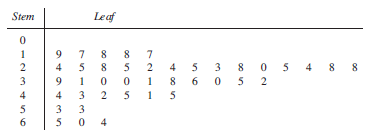
and reordering,

For these data, write down the values of
the range,
Show meThe range is 65 – 17 = 48
the median.
Show meUsing these 40 data values, the median is the (40 + 1) = 20.5th,
i.e. the average of the 20th and 21st values. This is (30 + 30) = 30.
Exercises
