
Venn diagrams can be used to help find probabilities when events are not mutually exclusive.
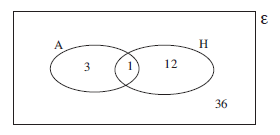
This Venn diagram illustrates the situation for a pack of cards where the set A is the aces and the set H is the hearts. Note that the total of the entries is 52, and the complete set is denoted by ε.
From the diagram
| p(Ace of Hearts) | = |
| p(Ace or Heart) | = |
| = | |
| = |
Worked Examples
In a class of 30 children there are 20 who can swim and 25 who can ride a bike. There is no child who cannot swim nor ride a bike.
Draw a Venn diagram and find the probabilities that a child selected at random:
can swim and ride a bike,
cannot swim but can ride a bike,
can swim but cannot ride a bike.
Show meLet R represent the set of children that can ride a bike and S represent the set of children that can swim.
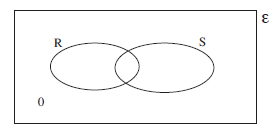
As each child belongs to R or S, a 0 can be placed as shown.
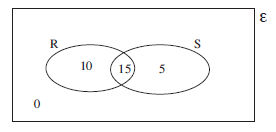
As 20 + 25 = 45
and 45 – 30 = 15
there must be 15 children in the overlap, so the diagram can be completed as shown.
The probabilities can now be found:
| p(can swim and ride a bike) | = |
| = | |
| p(cannot swim but can ride a bike) | = |
| = | |
| p(can swim but cannot ride a bike) | = |
| = . |
In a group of 40 students 6 are left-handed, 18 have size 7 feet and 2 are left-handed with size 7 feet. Draw a Venn diagram and find the probability that a student is :
left-handed or has size 7 feet,
not left-handed and does not have size 7 feet,
not left-handed and has size 7 feet.
Show me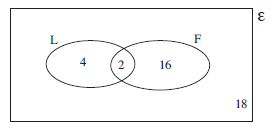
The number 2 is placed in the overlap
In F we have 18 − 2 = 16,
In L we have 6 − 2 = 4.
In the other space we have 40 − (4 + 2 +16) = 18.
Now the probabilities can be calculated.
| p(left-handed or size 7 feet) | = |
| = | |
| = | |
| p(not left-handed and does not have size 7 feet) | = |
| = | |
| p(not left-handed and has size 7 feet) | = |
| = |
Exercises
