
Coordinates
Plotting Straight Lines

By calculating values of coordinates you can find points and draw a graph for any relationship, such as y = 2x − 5.

Worked Examples

1
(a)

Copy and complete the following pairs of coordinates using the relationship y = x − 2.

(4, ?), (1, ?), (–1, ?)

Show me

For the first point x = 4 , so

y = 4 − 2
= 2

So the first point is (4, 2).

For the second point x = 1, so

y = 1 − 2
= −1

So the second point is (1, –1).

For the third point x = −1

y = −1 − 2
= −3

So the third point is (–1, –3).

(b)

Plot the points on a set of axes.

Show me
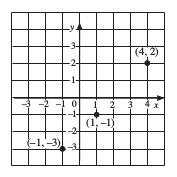
The points are plotted on these axes.

(c)

Draw a straight line through these points.

Show me
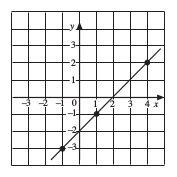
The three points lie on a straight line as shown on these axes.

2

Draw the graph of y = 2x − 1.

Show me

The first step is to find the coordinates of three points on the line. Choose any three x-values for the coordinates. Three possible values are given below.

(4, ?), (2, ?), (–2, ?)

Now calculate the y-values using y = 2x − 1.

For the first point x = 4 , so

y = 2 × 4 − 1
= 7

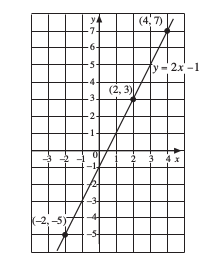
The coordinates of this point are (4, 7).

For the second point x = 2, so

y = 2 × 2 − 1
= 3

The coordinates of the second point are (2, 3).

For the third point x = −2 , so

y = 2 × (−2) − 1
= −5

The third point is (–2, –5).

These points are now plotted on the axes below. Then a straight line can be drawn through them.
Note

In fact, just two points uniquely define a straight line but it is safer to use three as a check.

Exercises

(a)

Complete the coordinates below using the relationship y = x + 2.

(4, ), (1, ), (–3, )

Draw a set of axes with x-values from –3 to 4 and y-values from –1 to 6.

Plot the points with the coordinates found in (a).

Check that the points lie on a straight line and draw a straight line through the points.

(b)

Write down the coordinates of the point where the line crosses the y-axis.

(, )
(a)

Use the relationship y = 3x − 2 to complete the coordinates below.

(3, ), (0, ), (–2, )

Plot these points on a set of axes and draw a straight line through the points.

(b)

Does the point (2, 5) lie on the line?

A teacher uses the relationship p = 4m to convert the marks obtained on a test to percentages. Here m is the mark and p is the percentage.

(a)

Complete the table below.

m01025
p
(b)

Complete the coordinates below using the contents of your table.

(0, ), (10, ), (25, )

Using m on the horizontal axis and p on the vertical axis, plot the points with the coordinates you obtained in (b).

(c)

Use the graph to fill in the missing entries in the following table.

MarkPercentage
Tyson15
Carlyle21
Shanice18
Carl80
Winston60

The relationship F = 32 + 1.8C can be used to convert temperatures in degrees Celsius, °C, to temperatures in degrees Fahrenheit, °F .

(a)

Complete the table below.

Temperature in °Celsius020100
Temperature in °Fahrenheit

Use the information in the table to draw a graph of F = 32 + 1.8C.

(b)

The recommended temperature for a greenhouse is 80 °F . Use your graph to convert this to °Celsius.

About °C
(c)

The temperature at a holiday resort is 30 °C. Use the graph to convert this to °Fahrenheit .

°F

Complete the following table for the rule.

(a)

"To find y, double x and add 1."

xy
0
1
3

Plot the values from the table onto a copy of the following coordinate grid.

Join your points with a straight line.

(b)

Write, in symbols, the rule

"To find y, double x and add 1."

(c)

Use your rule from part (b) to calculate the value of x when y = 9.

x =
(a)

Two points A and B are shown on the grid below.

Write down their coordinates.

A (, )

B (, )

(b)

Complete the table of values below for

y = x − 2

x–20234
y–22

Draw the graph of y = x − 2 on your copy of the graph above.

On the grid, draw the straight line AB.

(c)

Write down the coordinates of the point where the graph of y = x − 2 cuts the line AB.

(, )