
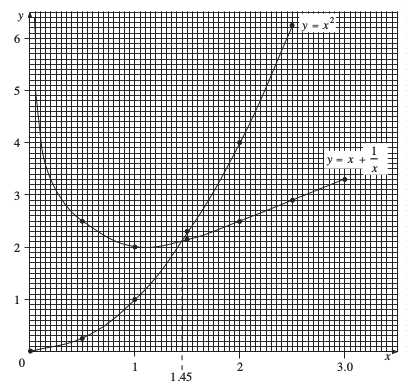
Equations of the form f(x) = g(x) can be solved graphically by plotting the graphs of y = f(x) and y = g(x). The solution is then given by the x-coordinate of the point where they intersect.
Worked Examples
Find any positive solutions of the equation
x2 = + x
by a graphical method.
Completing the table below provides the points needed to draw the graphs y = x2 and y = + x.
| x | 0 | 0.5 | 1.0 | 1.5 | 2.0 | 2.5 | 3.0 |
| x2 | 0 | 0.25 | 1 | 2.25 | 4 | 6.25 | 9 |
| + x | Infinity | 2.5 | 2 | 2.17 | 2.5 | 2.9 | 3.33 |
Where necessary the values have been rounded to 2 decimal places.
The graph below shows y = x2 and y = + x.
The curves intersect where x = 1.45 and so this is the solution of the equation.
The graph below represents the function
f(x) = x2 − 3x − 3

Use the graph to determine
the value of f(x) when x = 2
Show mef(2) = −5
the value of f(x) when x = −1.5
Show mef(−1.5) ≈ 3.6
the value of x for which f(x) = 0
Show meIntercepts with x-axis are x = −0.8, 3.8
the minimum value of f(x)
Show mefmin = −5.3
the value of x at which f(x) is a minimum
Show mex = 1.5
the solution of x2 − 3x − 3 = 5
Show mex = −1.7 and 4.7
the interval on the domain for which f(x) is less than −3.
Show me0 < x < 3
Note
The domain of a function is the values of x for which the function is defined. This is covered in Unit G4.
Given that y = 2x2 − 9x + 4
copy and complete the table below
| x | −2 | −1 | 0 | 2 | 4 | 6 |
| y | 30 | 4 | 0 | 22 |
Missing values:
f(−1) = 2 × (−1)2 − 9 × (−1) + 4 = 15
f(2) = 2 × 22 − 9 × 2 + 4 = −6
| x | −2 | −1 | 0 | 2 | 4 | 6 |
| y | 30 | 15 | 4 | −6 | 0 | 22 |
using a scale of 1 cm to represent 1 unit on the x-axis and 2 cm to represent 5 units on the y-axis, draw the graph of y = 2x2 − 9x + 4 for −2 ≤ x ≤ 6
Show me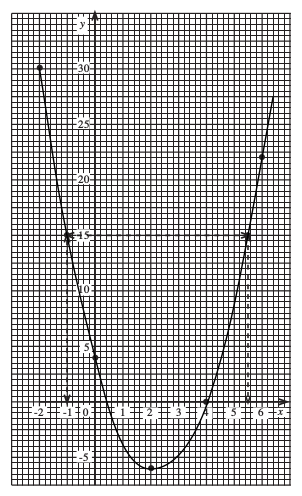
use your graph to solve the equation
2x2 − 9x + 4 = 15
Show meUsing the intersection of y = 15 with y = 2x2 − 9x + 4 gives estimates of the solution of
2x2 − 9x + 4 = 15
as x = −1 and x = 5.5 (see graph above).
The grid on the following page shows the line, l, which passes through the
points
Determine the gradient of the line, l.
Show me Gradient = = = 1Write down the equation of the line, l.
Show mey-intercept is −1, so equation of l is
y = −1 + x
(Alternative method: equation is of the form y = mx + c = x + c;
| to pass through the point (0, −1), −1 = 0 + c | ⇒ c = −1 |
| ⇒ y = x − 1) |
The table below shows three of the values of f(x) = x2 − 4x + 3 for values of x from 0 to 4.
| x | 0 | 1 | 2 | 3 | 4 |
| f(x) | 3 | −1 | 0 |
Copy the table and insert the missing values of f(x).
Show me| x | 0 | 1 | 2 | 3 | 4 |
| f(x) | 3 | 0 | −1 | 0 | 3 |
On a copy of the grid below, draw the graph of f(x) = x2 − 4x + 3.

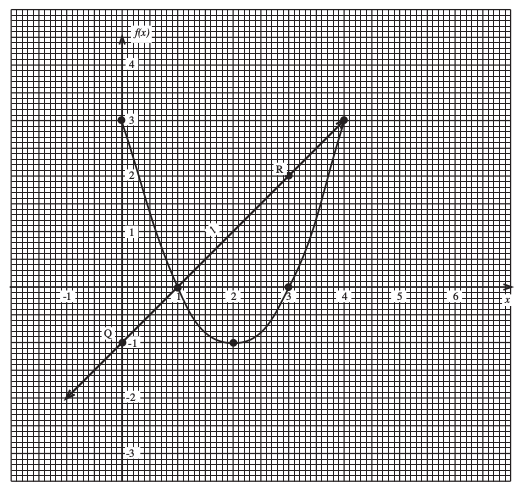
Using the graphs, write down the coordinates of the points of intersection of the line, l, and the graph of f(x).
Show me Points of intersection at (1, 0) and (4, 3).Exercises
